This site provides interactive tools designed to show what you might learn from Y chromosome testing (although everything here applies equally to mitochondrial DNA and maternal inheritance, the discussion is couched in terms Y-DNA). The focus here is on deducing a family tree within the past 5-15 generations, or 150 to 500 years.
The bulk of our DNA, called autosomal DNA, is combined and randomly split every generation, half from our mothers and half from our fathers. Such sexual mixing and selection is a powerful mechanism that provides a robust gene pool and quickly distributes advantageous genes. But Y-DNA does not recombine and is inherited intact, father-to-son. Aside from relatively rare and minor mutations, a male's Y-DNA today is identical to the Y-DNA of his father's-father's...father's DNA from thousands of years ago.
But those mutations are the magic. They are neutral (neither advantageous nor deleterious) and random -- and they come along for the ride on the Y chromosome and serve as markers over time. Imagine two brothers: one gets their father's Y-DNA as an exact copy, but the other's Y-DNA gets a tiny copy error. They now differ by one marker, and each will pass that marker down the generations. Many years later, if enough of their great-great-...-great grandsons get their Y-DNA tested, that change can be backtracked to when it must have occurred. The original boys' father becomes their descendants' MRCA: most recent common ancestor.
Our goal is to see if, and how, present-day Y-DNA testing can be used to reconstruct an entire family tree.
The frustration is that we get stuck with tantalizing but limited information: there are big gaps in our traditional genealogy, we don't have that many relatives who have done DNA testing, we don't always know how those with DNA results are actually related (third cousins or second-cousins once-removed?), and the DNA results are, frankly, a lot of gobbledygook in lists and tables. We paid our money, did the testing, joined a website -- now what?
To experiment and to learn we need perfectly known examples, so here we create fake but realistic and completely described family trees, including Y-DNA from the most recent generation, which becomes "ground truth". We then do experiments where we ignore that ground truth and see how much of the family tree we can reconstruct just from the DNA data. Then we compare our deduced tree with the true tree and see where and why they differ.
Bottom Line: Yes, a large family tree can be completely, perfectly deduced just from Y-DNA data. Software can do it in a fraction of a second. But...it requires thousands of DNA markers and extensive testing by distant cousins. With today's data you can get partway there, and we can describe the likelihood and types of errors.
Begin at the Create a Family tab. Then work your way along the other tabs.
Questions, comments, requests for features ? Contact Me Rob Spencer, March 2018
The fake family trees can be useful to develop your intuitions about the consequences of family size and generational time. You may know your direct ancestors back 5 or 10 generations, but you may not appreciate the large number of branches they also begat. For example, a common estimate is that each of the 31 surviving adult Mayflower pilgrims has 1,000,000 descendants today across generations 13, 14, and 15. While that's too many to display here, you can still use this tool to see how families grow: it will tell you the expected size, even if it's too large to draw.
Every time you click the blue button you get a different tree. Click away and notice how, by chance, some families are large and others die out.
The names Adam, Brian, Charles,.. are whimsical but useful for reference.
The average British family size centered around 4.5 from 1550 to 1750, rose to almost 6 by 1820, and then dropped to about 2 between 1820 to 1940. It has remained near 2 since then. In the United States, ignoring Native Americans, family size began at about 7.5 in 1630 and declined steadily to 6 in 1800. Like Britain, it then declined to today's value of about 2.
This tool models Y chromosome processes, so the complexities of remarriage, adoption, or consanguinity do not apply. "Family size" means the number of surviving adults per generation; it is basically the total fertility rate, where a value of 2 gives replacement without growth. For a given average family size, a specific family size is generated according to the Poisson distribution. From that, the number of boys is chosen according to the binomial distribution. The tool uses a reproducible pseudo-random number generator so that results can be exactly repeated.
This tree includes only those with DNA tests and their direct ancestors. The full tree remains visible at the "Create a Family" tab.
This tool will also simulate realistic patterns of Y-DNA STR values. Create a family tree at the previous tab, then add Y-DNA data here. Revisit the tree at the first tab: it has re-colored to highlight those who had their DNA tested. Note how huge swathes of the family are invisible if you only do testing on a small number of cousins. The tree shown here is pruned to show only those tested and their direct ancestors.
The genotype for each person tested -- the DNA pattern of his STRs -- is shown in the gray grid below the tree. The names for the markers (D301, D302..) have no relation to real markers; they are there only to make the diagram familiar. The value of each marker is arbitrarily set at 10 for "Adam", and mutations move this up or down. The color scheme is that same as used at FTDNA for colorized DNA results. The mutation rate is set to published average values for the common testing kits (37, 67, or 111 markers), otherwise it's set to 0.0026 per marker per generation.
The people with STR data are shown in the same order as the family tree; note how you can easily see vertical lines of mutations, and track back in the family to the common ancestor where it's most probable that the mutation arose.
Every time you click the blue button you get a different set of STRs. Click away and notice how, by chance, you may get a rich or sparse pattern of STRs.
The larger numbers of markers (over 111) won't show here but will have a major effect on the deduced tree on the next tab.
SNPs mutate much too slowly to be of use in building family trees within the genealogical time scale. The major patterns of SNPs (haplogroups) diverged 20,000 to 50,000 years ago -- a 3,000 year old SNP is considered recent -- so they're good for distinguishing ancient migrations or saying that two people are genetically unrelated. But SNPs cannot distinguish your great-great-uncle from your great-great-grandfather, which is what we need to deduce the fine structure of a family tree.
This is the same subset from the previous tab.
Use the menu to change the number of Y-STR markers. You will see that as the number of markers increases, the lower tree gets more and more accurate. At 100,000 markers it will be essentially identical to the upper, true tree. This is very gratifying: with enough markers, Y-STR data alone could completely reconstruct a family tree.
But the reality is that we do not have 10,000+ markers. Until whole-genome sequencing gets much cheaper and more people are willing to share DNA data, we will have to accept that our deduced tree will be imperfect.
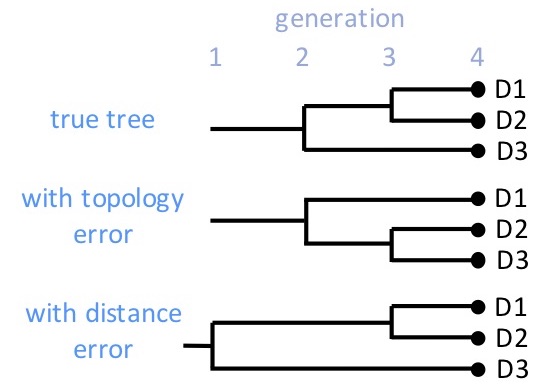
There are two types of error that can occur. In the sketch at the right, the truth is that D1 and D2 are siblings and both cousins to D3. But with a topology error, D2 and D3 might be shown as siblings and D1 their cousin. The branching is incorrect. There is also distance error where the generational distance into the past is incorrect. The sketch shows an example where D3 is estimated to be a second-cousin, rather than a first cousin to D1 and D2. Both types of error can occur with limited data: mutation is a random, probabilistic event, so our reconstruction of family trees cannot be perfect.
Hopefully you've experimented with the tools here and have developed your own understanding of how much, or how little, Y-DNA testing may contribute to building out your own family tree. Having automated these tools and have done thousands of runs, varying all of the inputs and watching the accuracy of the deduced distance tree compared to the ground-truth family tree, the general observations are
I will continue to explore two avenues which may improve what we can learn from Y-STR results. First will be to consider how particular facts might constrain and guide the modeling. For example, if we know (from family history) that two of the DNA testers are second cousins, that means that they share a great-grandfather, and that could pin down the models. Secondly, the distance trees here use only genetic distance and take no account of specific markers. Building possible trees by back-tracking every marker is a completely different way to approach a family tree (graph theory rather than geometry). The techniques should be complementary and I will try to combine them.